In the last two weeks I looked back at the 2022 markets and marked where I made sales. This week I will show where and how I made sales so far for 2023 and what I see on February 23rd looking forward.
Corn Sales
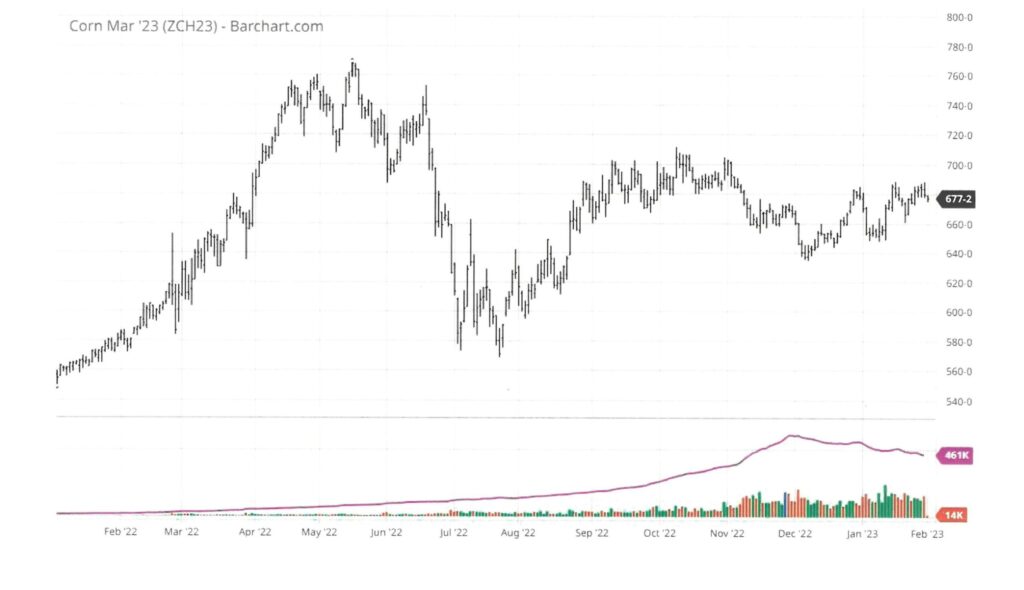
Here are the sales I have made so far charted for corn.

On April 19, 2022 (the first red tick mark) I sold the first 10% of the expected production in a Min-Max strategy. The minimum price was $6.60 and the maximum was $7.10. This program would price grain everyday at $6.60 or better and if the price was above $7.10 the contract that day(s) the price would be $7.10 and the pricing period was from April 19th to November 25, 2022. The final price on that contract was $6.6073. Number of days the market traded above $6.60, only two. So that is why the price was so close to the minimum.
On December 2, 2022 (second red tick mark), I used another min-max strategy to price another 20% of the expected crop. The minimum for that contract is $5.80 and the maximum is $6.50. That contract will continue to price daily from 12-2-2022 to 6-23-2023. You can see that this contract has not priced very long above $5.90, but there is still about half of the contract to go. Most importantly this contract will price daily through the planting window and early summer.
If we see issues, I expect the prices to rise and challenge the maximum. Should that happens, I will likely price another 10-20%. Let’s say we get through the March 31st planting intentions report and weather is good, the crop gets planted timely and we have good weather in June, this market will grind lower. If I see that we are getting planted on time and things look good I will look to price at least 10% more before June 1.
Soybean Sales
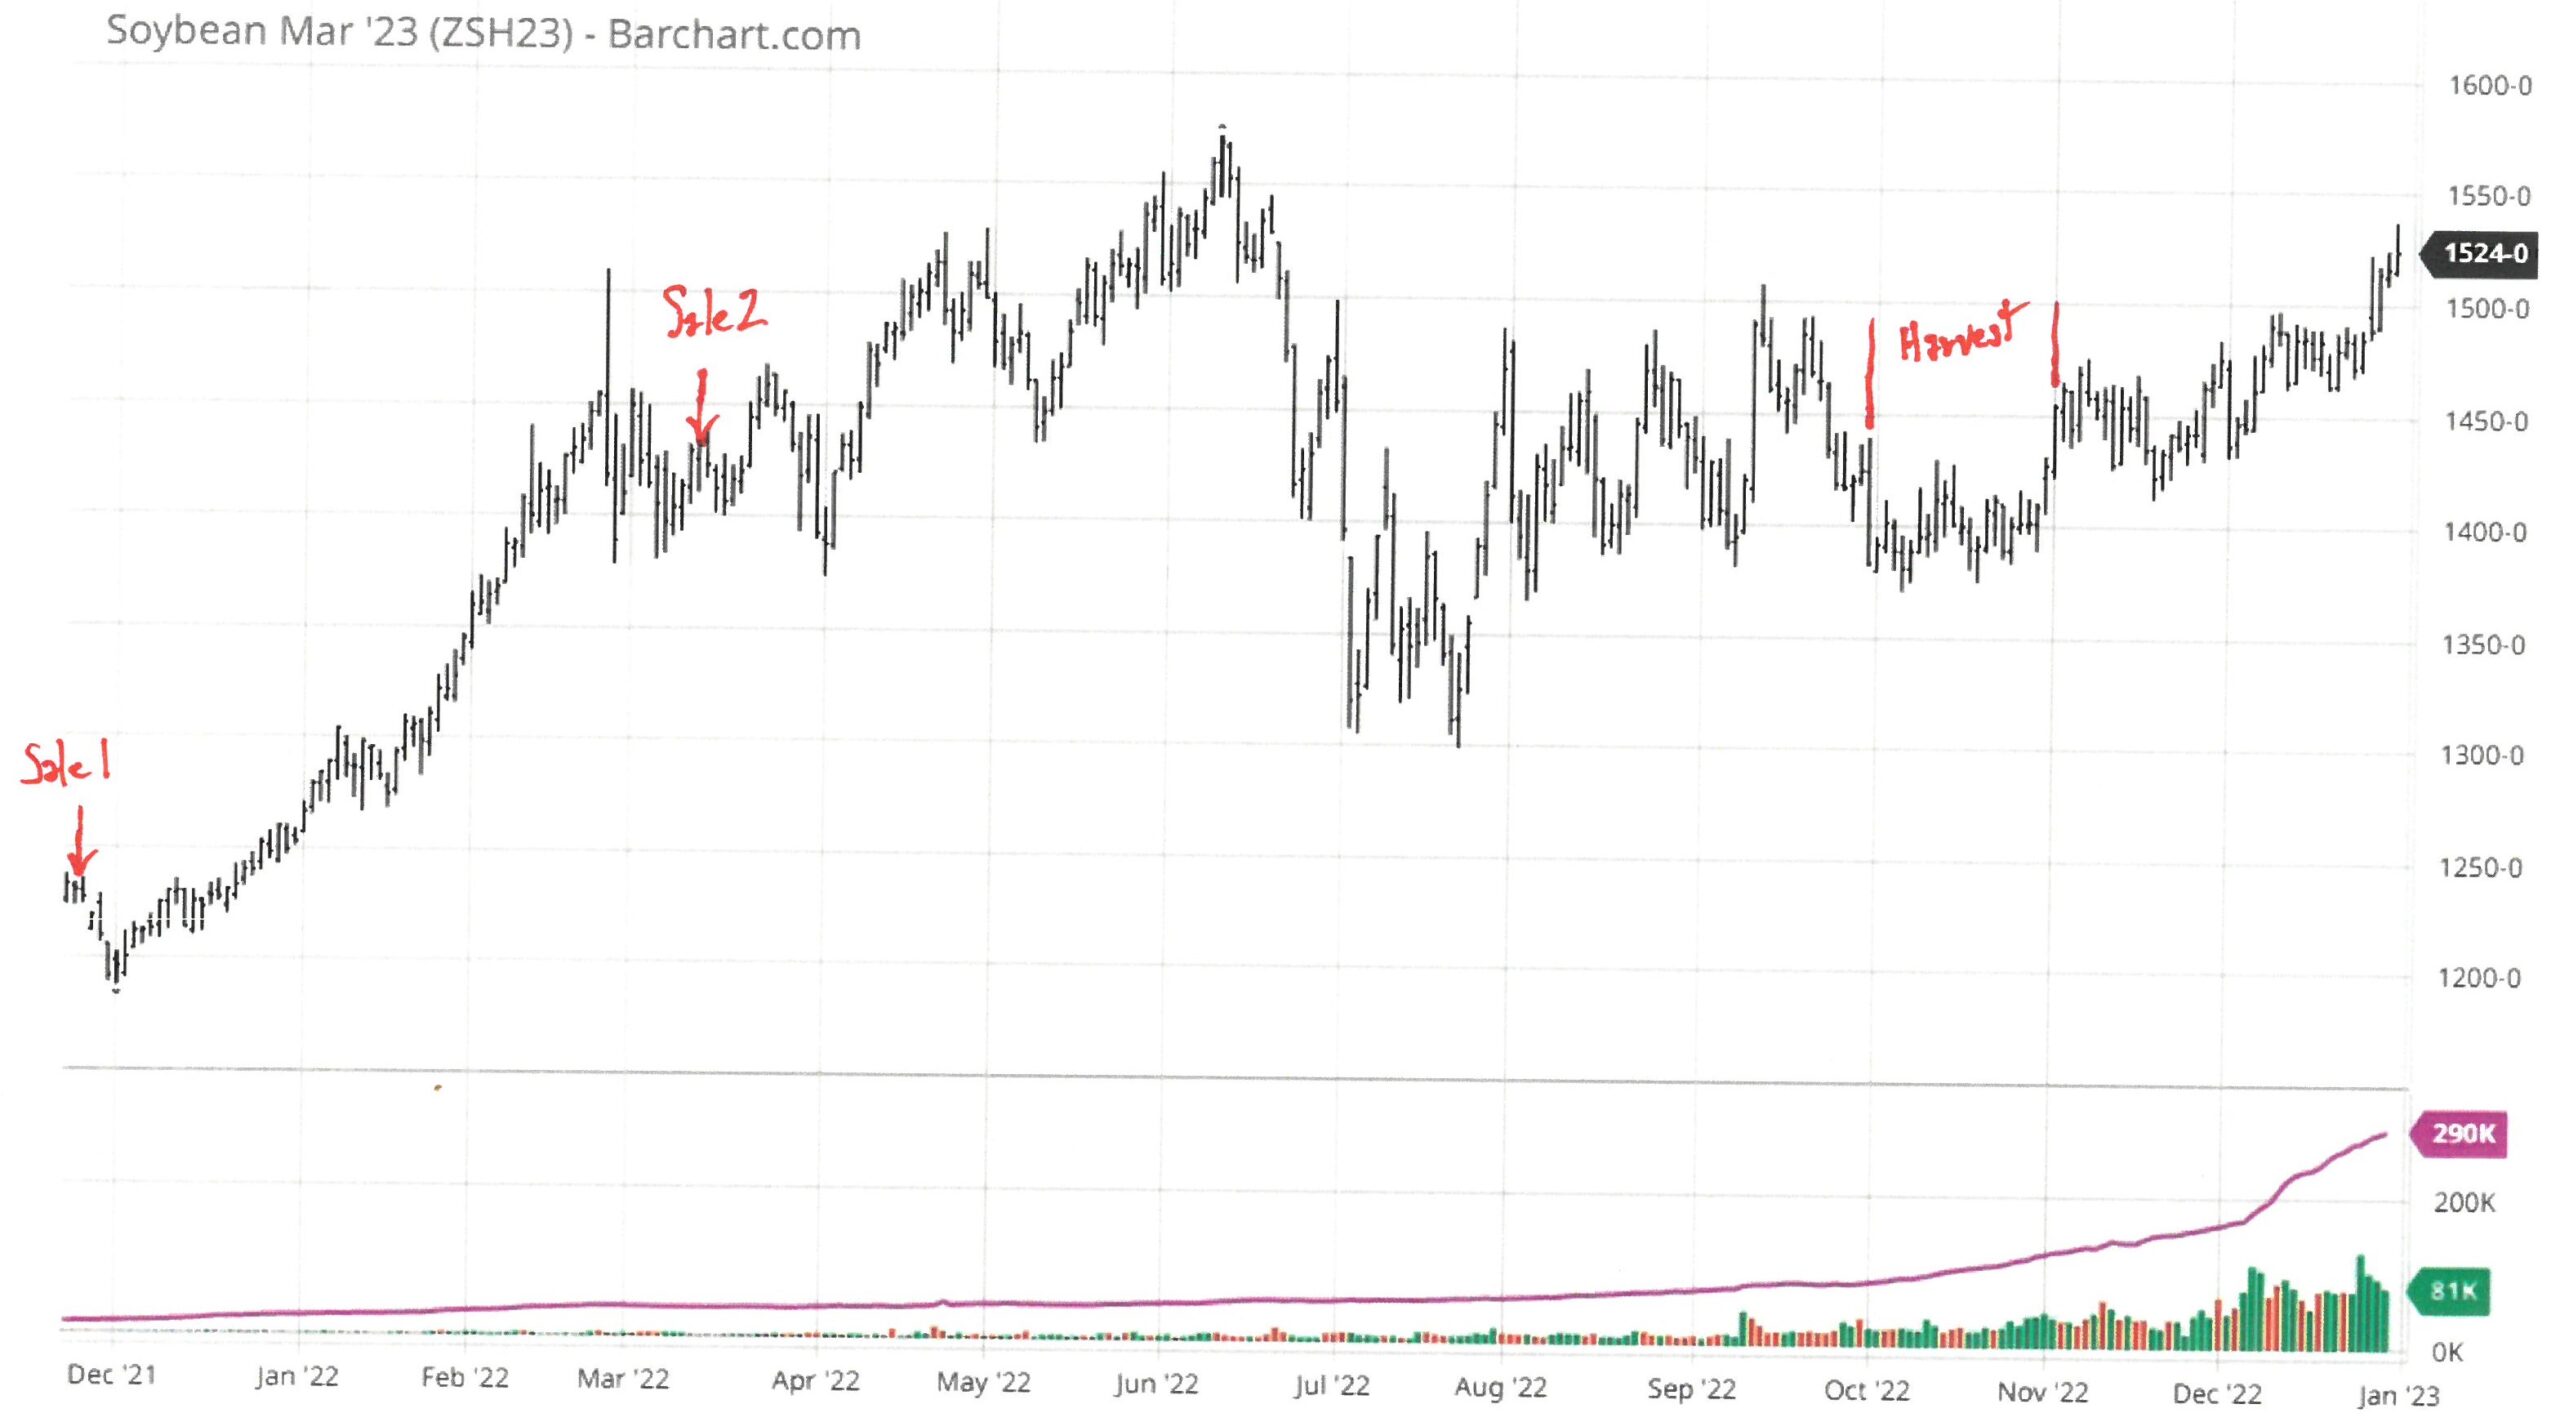
Here is the chart.

For the soybean crop I employed a totally different strategy. On August 23, 2022 I sold 15% of the expected production at $13.97 using a hedge-to-arrive contract. I simultaneously sold the same number of bushels by selling a $14.00 call for $1.20. This strategy guarantees 15% of the crop at $13.97 less basis next fall. If the price on October 27, 2023 is over $14.00 we will have a sale at $14.00 plus the premium of $1.20 less fees and basis. If the price is under $14.00, we will get to keep the $1.20 and add it to a sale at the time.
At the time I made the sale this was a very solid strategy. This remains a great strategy. If the market rallies significantly you are covered until $15.20 ($14.00 plus $1.20). Why did I employ this type of strategy? At the time the calls were expensive and the risk in my opinion was to the downside (I was skeptical that the market would stay high). As everyone knows, no one is always right or always wrong. This strategy leaves open the opportunity on 15% of the bushels to be priced higher than $14.00. The downside breakeven is $12.77 ($13.97 – $1.20). If the market gets close to that price, I will price those bushels. I want to preserve that price close to $14.00 for the first 30% of the crop.
What do we know to predict the future?
Now for the toughest part of the blog. Where do I see the markets headed this year? First let’s look at what we know or strongly believe. South American harvest is over half complete for soybeans. Brazil appears to have a record crop. Argentina is poor and getting worse every week. The combination in all that I have read is that the totals will be like an average or slightly better soybean crop. Argentinian corn will be poor but that can only offer a little support to corn prices.
Second, most of the forecasts for corn acreage are that it will increase by 2 to 4 million acres. Two million is hard to digest for the market, four is extremely difficult to keep prices where they are right now. My sources and my gut tell me that we are looking at 91 to 92 million acres of corn to be planted in the U.S. In 2022, we planted 88.6 million acres. The USDA will use a trendline yield of 181.5 bushels per acre. That gives us a production of around 15.3 billion bushels. We use about 14.1 bushels each year. That leaves about 2 billion bushels left over. That much carry over suggests that the average price will be $5.60 or lower.
USDA March Report
Every year, the March 31 USDA planting intentions report is critical because it sets the bar for pricing between 3-31 and 6-30 every year. If the acres are high, the market will use the trend line yield all spring until there is significant reason to not use that yield. I would tell you I believe the average farmer breakeven price for corn is above $5.80. That just puts more pressure on the market as the “perception” is that farmers will not sell below that price. It also makes weather less of a threat until it gets pretty severe (too wet, too dry, too hot, too cold). There will be many who employ a hope strategy, (hoping that the prices get back to $5.80 before they sell). December corn is trading at $5.92 on the open this morning.
So, if that is the forecast for corn, what does that do to soybean acreage? The USDA February forecast is for $87.5 million acres. Trendline yield is 52 bushels per acre. You get a total production of 4.5 billion bushels and a usage of 4.2 billion bushels, leaving carryout at 300 million bushels. That would suggest an average price of $12.90. Most years the 2 crop average acres is around 178 million acres. I
I am hearing that in the South, cotton is losing favor for this year. Those acres generally get converted to soybeans. If those acres are converted it is harder to keep the average yield at 52 but it still adds to the soybean balance sheet. That is negative soybean price.
Where from Here?
I still have yet to take a position. Here is that position today. I am likely to make another sale for corn in the next 30 days. My belief is that corn has more downside and the price is still historically high for this time of year. Patience is my strategy for soybeans to see how the acreage estimate ends up and how South American harvest finishes. I want to be closer to 50% once we get to June 30th assuming things look good after planting.
This time of year is always full of speculation of what the futures holds. I try to sort through all of the information and use my experience to make the best sales possible. It is always fluid and interesting to watch the spring play out and to analyze what I think the future holds.
Thanks for reading. Next week’s blog will focus on land values.


 The necessity of quarantine over the last few months has presented unique challenges for businesses and organizations across the board. As COVID-19 made its way across the Midwest, our office took the precautions that many others adopted in an effort to keep our staff and clients confident of our investment in their well-being. As we reopen and get back to business as normal, we are glad for the success of our measures and grateful for the patience and understanding granted.