What do 2023 grain price prospects look like?

In the last two weeks I looked back at the 2022 markets and marked where I made sales.  This week I will show where and how I made sales so far for 2023 and what I see on February 23rd looking forward.

Corn Sales 

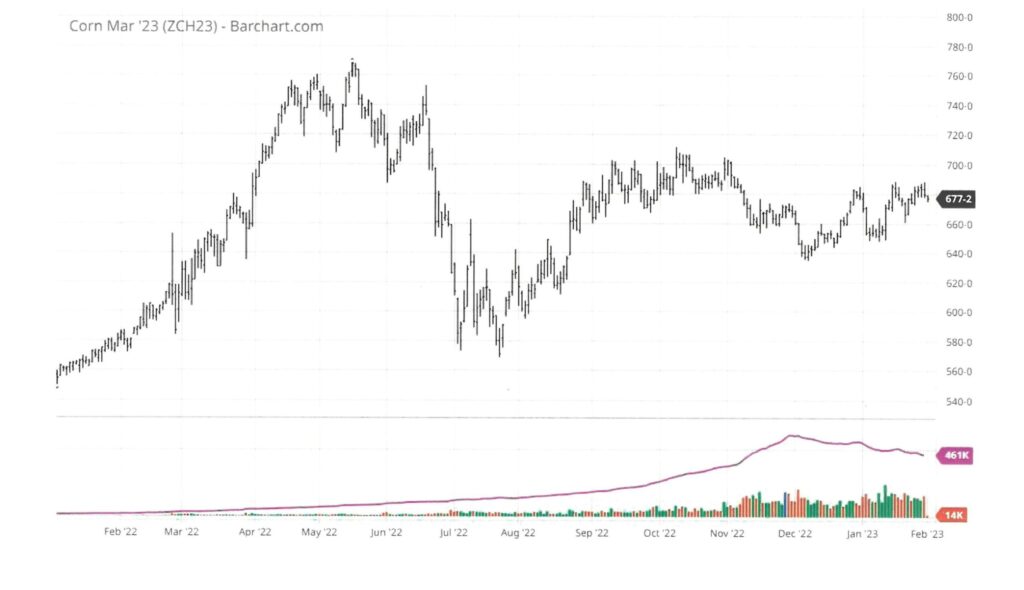
Here are the sales I have made so far charted for corn.


On April 19, 2022 (the first red tick mark) I sold the first 10% of the expected production in a Min-Max strategy.  The minimum price was $6.60 and the maximum was $7.10.  This program would price grain everyday at $6.60 or better and if the price was above $7.10 the contract that day(s) the price would be $7.10 and the pricing period was from April 19th to November 25, 2022.  The final price on that contract was $6.6073.  Number of days the market traded above $6.60, only two.  So that is why the price was so close to the minimum.

On December 2, 2022 (second red tick mark), I used another min-max strategy to price another 20% of the expected crop.  The minimum for that contract is $5.80 and the maximum is $6.50.  That contract will continue to price daily from 12-2-2022 to 6-23-2023.  You can see that this contract has not priced very long above $5.90, but there is still about half of the contract to go.  Most importantly this contract will price daily through the planting window and early summer.

If we see issues, I expect the prices to rise and challenge the maximum.  Should that happens, I will likely price another 10-20%.  Let’s say we get through the March 31st planting intentions report and weather is good, the crop gets planted timely and we have good weather in June, this market will grind lower.  If I see that we are getting planted on time and things look good I will look to price at least 10% more before June 1.

Soybean Sales

Here is the chart.

For the soybean crop I employed a totally different strategy.  On August 23, 2022 I sold 15% of the expected production at $13.97 using a hedge-to-arrive contract.  I simultaneously sold the same number of bushels by selling a $14.00 call for $1.20.  This strategy guarantees 15% of the crop at $13.97 less basis next fall. If the price on October 27, 2023 is over $14.00 we will have a sale at $14.00 plus the premium of $1.20 less fees and basis.  If the price is under $14.00, we will get to keep the $1.20 and add it to a sale at the time.

At the time I made the sale this was a very solid strategy.  This remains a great strategy.  If the market rallies significantly you are covered until $15.20  ($14.00 plus $1.20).  Why did I employ this type of strategy?  At the time the calls were expensive and the risk in my opinion was to the downside (I was skeptical that the market would stay high).  As everyone knows, no one is always right or always wrong.  This strategy leaves open the opportunity on 15% of the bushels to be priced higher than $14.00.  The downside breakeven is $12.77 ($13.97 – $1.20).  If the market gets close to that price, I will price those bushels.  I want to preserve that price close to $14.00 for the first 30% of the crop.

What do we know to predict the future?

Now for the toughest part of the blog.  Where do I see the markets headed this year?  First let’s look at what we know or strongly believe.  South American harvest is over half complete for soybeans.  Brazil appears to have a record crop.  Argentina is poor and getting worse every week.  The combination in all that I have read is that the totals will be like an average or slightly better soybean crop.  Argentinian corn will be poor but that can only offer a little support to corn prices.

Second, most of the forecasts for corn acreage are that it will increase by 2 to 4 million acres.  Two million is hard to digest for the market, four is extremely difficult to keep prices where they are right now.  My sources and my gut tell me that we are looking at 91 to 92 million acres of corn to be planted in the U.S.  In 2022, we planted 88.6 million acres.  The USDA will use a trendline yield of 181.5 bushels per acre.  That gives us a production of around 15.3 billion bushels.  We use about 14.1 bushels each year.  That leaves about 2 billion bushels left over.  That much carry over suggests that the average price will be $5.60 or lower.

USDA March Report

Every year, the March 31 USDA planting intentions report is critical because it sets the bar for pricing between 3-31 and 6-30 every year.  If the acres are high, the market will use the trend line yield all spring until there is significant reason to not use that yield.  I would tell you I believe the average farmer breakeven price for corn is above $5.80.  That just puts more pressure on the market as the “perception” is that farmers will not sell below that price.  It also makes weather less of a threat until it gets pretty severe (too wet, too dry, too hot, too cold).  There will be many who employ a hope strategy, (hoping that the prices get back to $5.80 before they sell).  December corn is trading at $5.92 on the open this morning.

So, if that is the forecast for corn, what does that do to soybean acreage?  The USDA February forecast is for $87.5 million acres.  Trendline yield is 52 bushels per acre.  You get a total production of 4.5 billion bushels and a usage of 4.2 billion bushels, leaving carryout at 300 million bushels.  That would suggest an average price of $12.90.  Most years the 2 crop average acres is around 178 million acres.  I

I am hearing that in the South, cotton is losing favor for this year.  Those acres generally get converted to soybeans.  If those acres are converted it is harder to keep the average yield at 52 but it still adds to the soybean balance sheet.  That is negative soybean price.

Where from Here?

I still have yet to take a position.  Here is that position today.  I am likely to make another sale for corn in the next 30 days.  My belief is that corn has more downside and the price is still historically high for this time of year.  Patience is my strategy for soybeans to see how the acreage estimate ends up and how South American harvest finishes.  I want to be closer to 50% once we get to June 30th assuming things look good after planting.

This time of year is always full of speculation of what the futures holds.  I try to sort through all of the information and use my experience to make the best sales possible. It is always fluid and interesting to watch the spring play out and to analyze what I think the future holds.

Thanks for reading.  Next week’s blog will focus on land values.


What did we expect from the markets? Part 2 (A 2022 soybean market summary)


From the last post you know that 2022 had some unexpected events that caused uncertainty in the grain markets.  While the two primary commodities act in tandem most of the time, it is not always the case.  The US is the big producer in Corn; the US and South America dominate the Soybean complex.  This is a change that has happened during my 35 year career and has caused us to pay keen attention to what goes on in Brazil and Argentina (the two primary producers of soybeans in South America).  Let’s dig deeper.

(Barchart.com, n.d.)

2022 Soybean Chart 1/1/2022-12/31/2022

Again apologies for using the March soybean chart but it was all that was available for this presentation.  The spread on soybeans the last two years has been inverted ( the future month is lower than the lead new crop month, November).  Currently the spread between November 23 soybeans and March 24 soybeans is -.11.  In market terms, they want the soybeans at harvest more than they want them in January or February 2024.  For this discussion, we will assume that the prices in the chart above are similar to the November 2022 chart (though we know that at times during the year the spread was a little higher or a little lower than the November price).

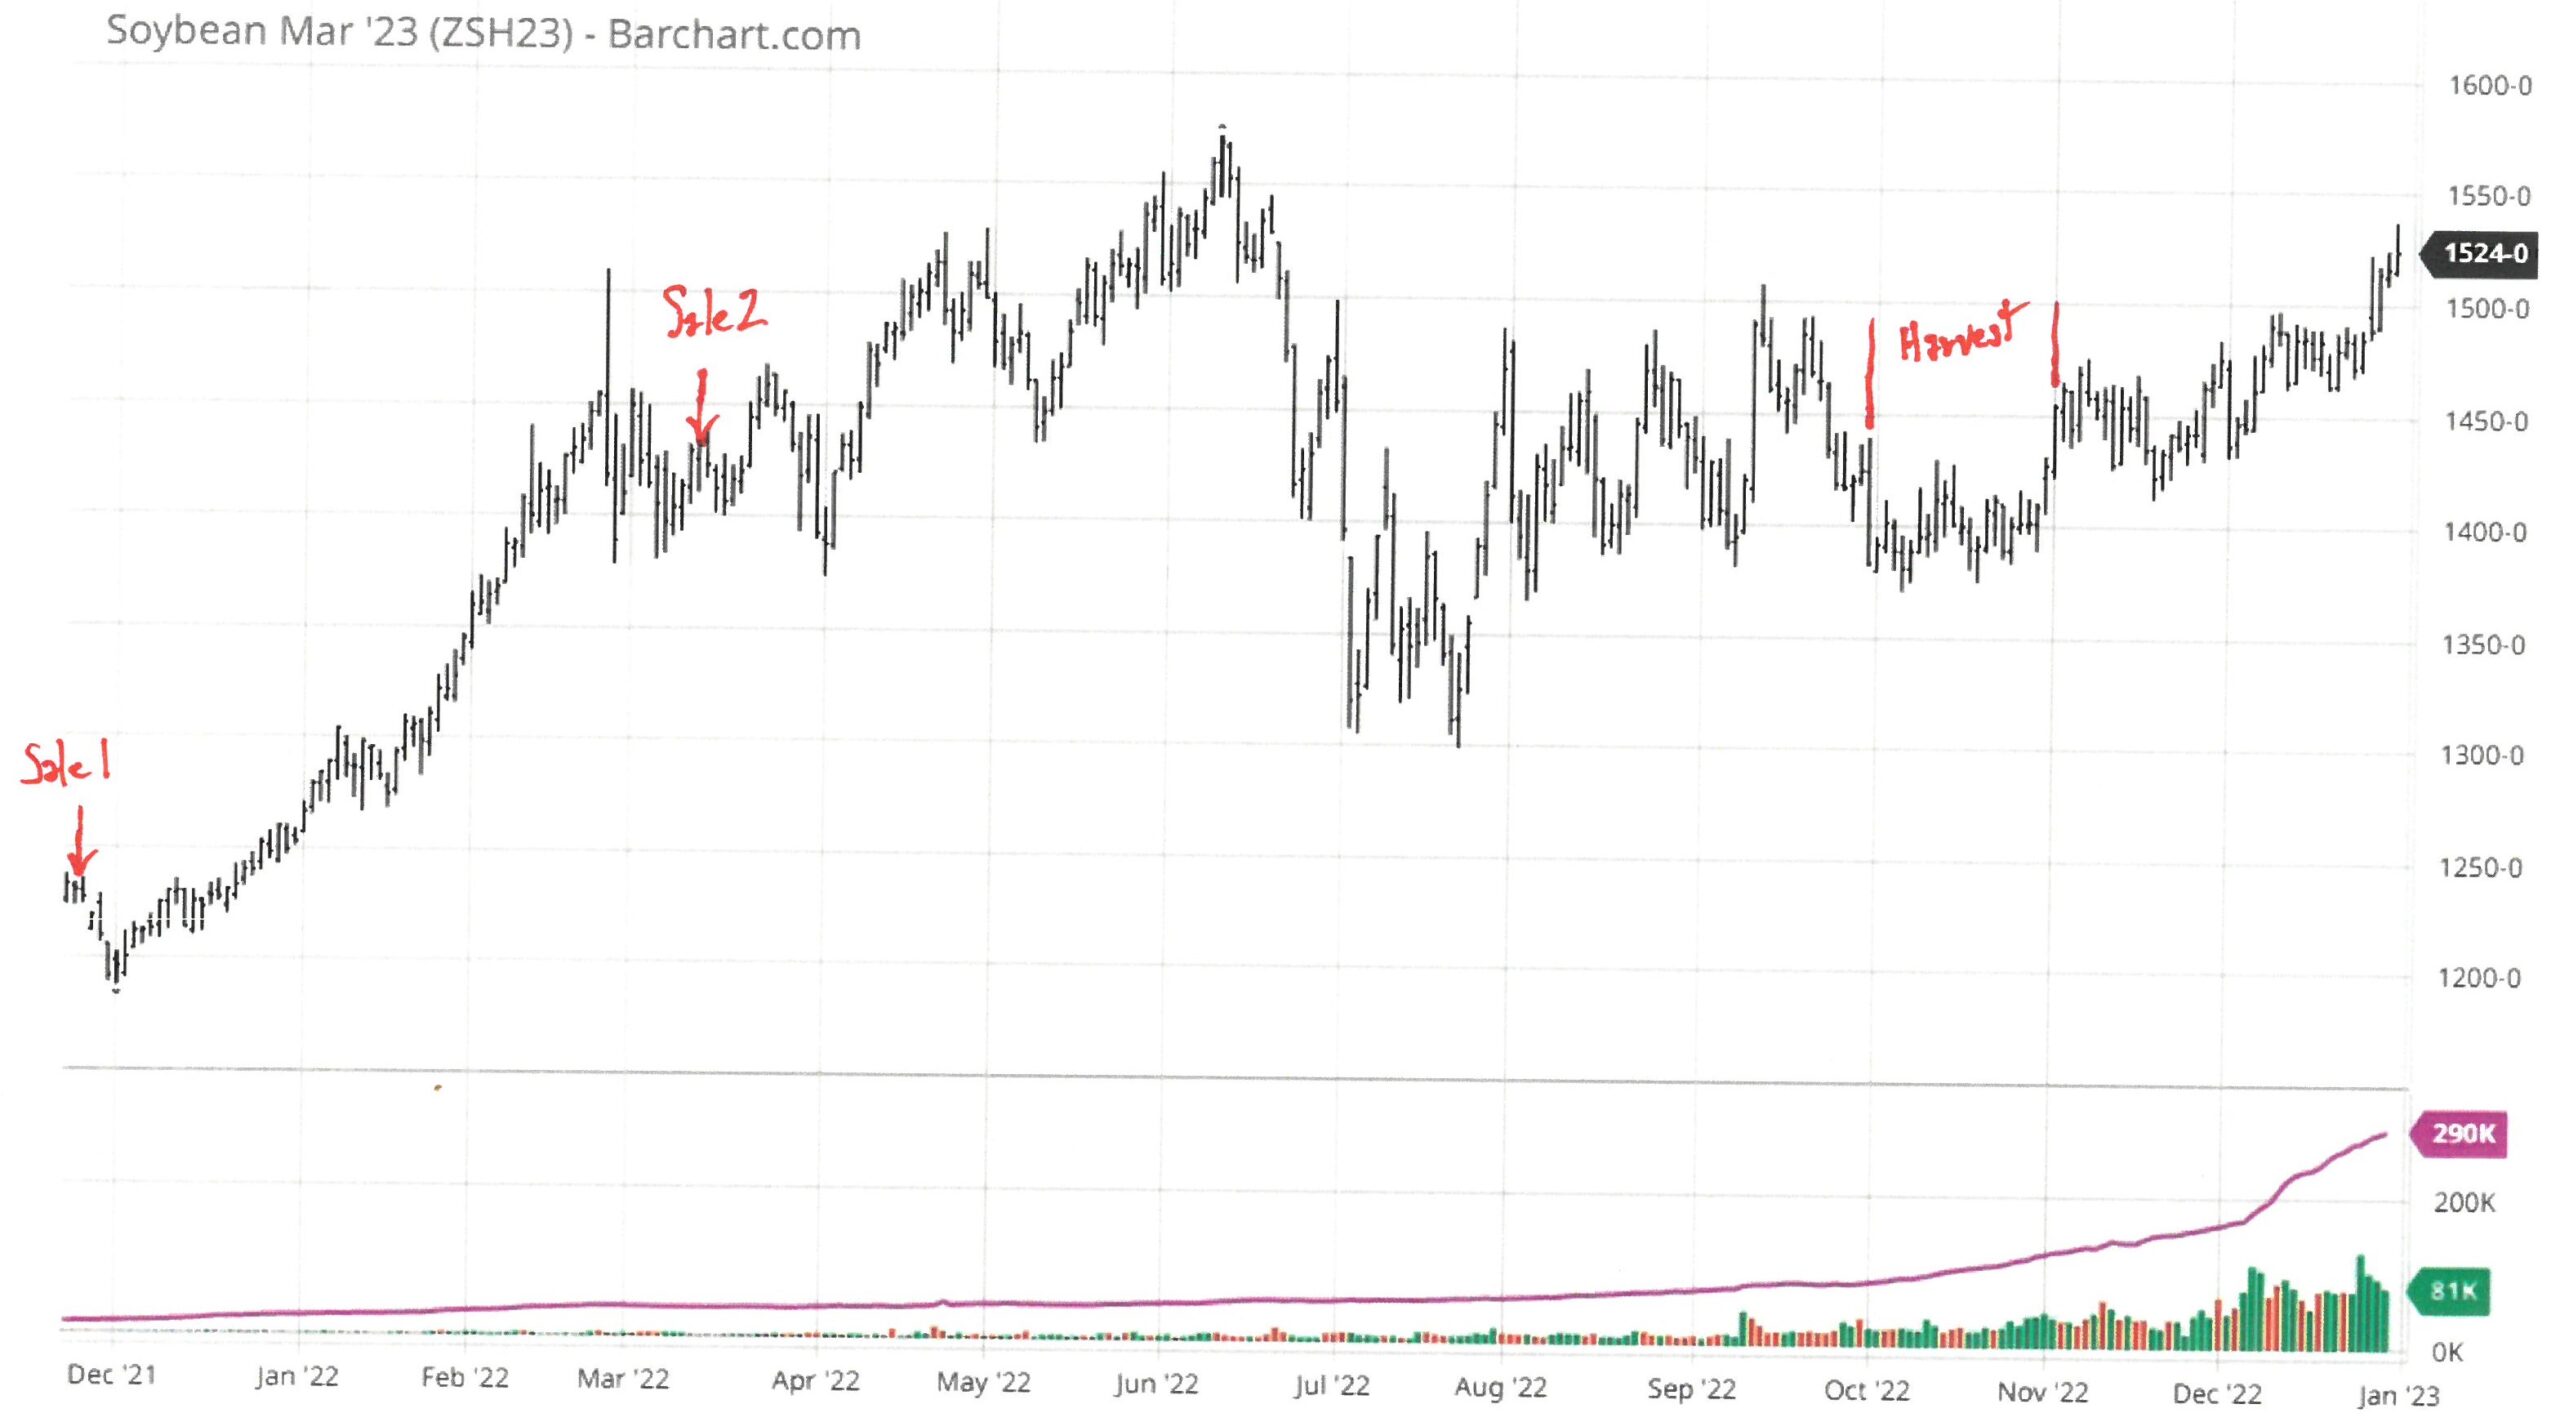
So the low for the year was right at the beginning of the year 1/3/2022 at $12.56 (the first red tick mark).  The next tick mark is at the high of the year $15.72 on June 9th.  The market fell quickly to $12.99 on July 22nd and rose back to $15.08 on September 13th.  Coincidentally harvest begins in September so the market reacted and fell to $13.71 on October 6th, analyzed harvest data and rose to $15.24 on December 30, 2022.  If you look at the numbers without the charts it doesn’t appear to be too volatile.   The charts help tell that story more completely.  The last tick mark shows that the market rose to $15.48 ½ on January 18th, but closed that day down 15 cents at $15.24.

Those moves up $3.16 to down $2.73, up $2.09, down $1.37 and finally up $1.53 demonstrate that extreme volatility.  This was the main driver for my market strategy on soybeans last year.  It is really hard to mentally weather those kinds of swings.  Sometimes we are busy and don’t catch the movement, but most times we are trying to figure why we were so wrong.  In the grain markets it seems the glass is always half empty and never half full.  Grain marketing is difficult and not always rewarding.

Supply and Demand

It is hard to have any sort of discussion about soybeans with out talking about the major world players.  The two largest producers are the US and South America.  Their growing seasons are exactly opposite meaning when we are planting, they have just finished harvest.  When we are harvesting, they are starting to plant.  For the consumers or end users, this gives ample opportunity to secure supply.  It is rare that both major producers have production hiccups in the same year.  So while the end users preferred producer (US or South America) may be short of supply, the next largest producer’s supply is only six months away from export.

The primary consumer by a factor of almost seven is China.  China is estimated to import 96 million metric tons of soybeans from the 2022 US crop and 2023 South American crop.  The next closest importer is the European Union at 14.4 million metric tons.  China is the elephant in the room for sure.  This may be some insight into why Chinese relations are important to Agriculture.  What is a metric ton?  1,000 kilos or 2,205 pounds make a metric ton.  The conversion to bushels is China will buy 3.5 billion bushels of soybeans in 2022-23.  The estimated US exports in 2022-2023 is about 2 billion bushels, so we are the #1 exporter in the world with South America close behind.  We will use 2.3 billion bushels domestically in 2022-23.

In the January 2023 WASDE report, the US was expected to have only 4.8% of the crop left over at the end of September 2023.  That sounds like it is plenty since the 2023 harvest will be coming on, but it does leave a fair amount of fear for the growing season.  More discussion about 2023 crops on the next post.

Actual Results

Here is the chart showing sales made for the 2022 soybean crop.

(Barchart.com, n.d.)

The first sale on 11/23/2021 was a min/max contract for 40% of the expected production at a price no lower than $12.40 and no higher than $12.90.  The final price was $12.8358 (nearly at the maximum of the range).  The second sale on 3/14/2022 for 20% of the expected production was a min/max contract at a price no lower than $14.40 and no higher than $15.20.  The final price was $14.7486 (about the mid- point of the range).  The final sale was made at harvest.

The reason for the min/max approach was we really were not sure of the direction of the market.  It sets the minimum price and gives you some upside for the future.  The other choices were to price the first portion at $12.30 less a 12 cent fee (which wasn’t attractive at that point) and $14.23 less a 10 cent fee which again wasn’t attractive.  Looking back the biggest mistake was biting off such a big chunk of the crop at the beginning.  The issue was that we were coming off a mediocre crop with very little exports.

Specifically the USDA in November 2021 was projecting a $9.00 average price for sale of 2022 soybeans.  A $12.40 sale looked too good.  Then ironically in January 2022, the USDA adjusted the WASDE balance sheet and lowered the beginning balance to start the season (Unfortunately, this is not uncommon for the reporting we get from the USDA!).  As you can see the market began it’1s ascent to higher levels fueled by that and the Ukrainian conflict.  The second sale was again out of concern that we might have a key market reversal.  Again, did not turn out to be the case, but that sale was certainly respectable.

Conclusion

I have prepared these posts not as an excuse for lower prices than I hoped for this crop, but to give you, the reader, insight to the cycle that we see in agriculture.  This cycle is annual in nature and comes with many twists and turns.  Like the weather, the grain market is uncontrollable.  It has the ability to reward and challenge even the most seasoned marketers.  This presentation is as much for me to reflect and critique my methods and results as it is to inform you.  It is always our goal to do better, admit our mistakes, exceed expectations and work harder for all of our clients.

Next week I will discuss the 2023 outlook and sales completed to date.  Thank you for your time!

What did we expect from the markets? Part 1 (A 2022 corn market summary)


Unfortunately this is a question that has no defined answer and one we look to answer every year at this time.  There are several factors that help show us direction and definition but as always, the best marketing plans can be the wrong plans in the midst of two dry weeks in June or July.


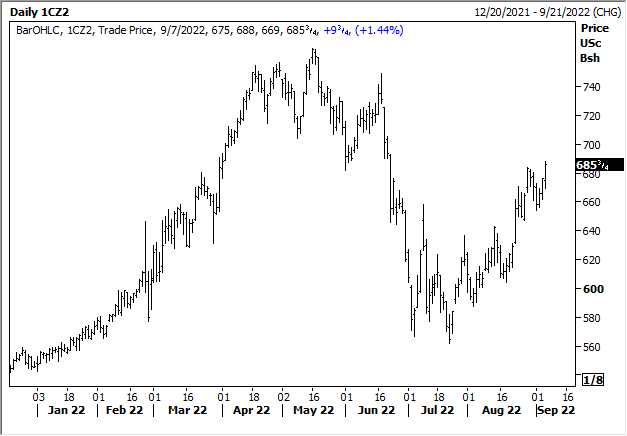
I hope to start the discussion by looking at the immediate past.  Here is the chart for 2022 corn (It is a March chart as December 22 is no longer available.  Prices are about 6 to 15 cents higher than December but it is all relevant to the story).


As I discussed in my client letters this year, the low was in the first trading day of the year.   The high was in mid-May, the next low was in mid-July.  The difference in that market move was EXACTLY $2.00 per bushel.  The next leg up was $1.43 per bushel and that high was October 10.  Why look backwards when the results are in and finished?  This is one of the most dramatic markets in my 35-year career.  It left many opportunities for wins and just as many opportunities for losses.  We are faced with opportunities every single year.  Most don’t have this kind of drama involved.

So, what were the market signals that drove the market to the extremes.  The first mover was the war in Ukraine.  Uncertainly leads to volatility.  Volatility means opportunity.  We don’t always recognize those but we are aware that something is happening.  The conflict was much about uncertainty and the most fertile region in eastern Europe.  Ukraine is a large producer of wheat, sunflowers and corn.  They export to much of the Eastern hemisphere.  The ports being closed was/is a big deal but there was messaging that it would not last or might be short-lived.  Ports closed and exports stopped.  First factor of the market (and unexpected in November of 2021).

The second factor was the USDA planting intentions report on March 31, 2022.  Corn acreage came in below expectation and the effect to the supply demand balance sheet for corn was thought to be problematic.  This reports tries to catch what farmers intend to plant during the growing season.   Weather began to play a part in the markets in April as the war waged on.  The price rose to $7.68 in mid-May.  As happens most times, the corn crop got planted although it was already dry in the South (TX & OK) and the Dakotas.  (Most times those areas are sort of non-factors).

When June 30th rolled around another USDA report for actual planted acreage was released.  Corn dropped 28 cents after the release of the numbers.  Sadly, the acreage was down 1.18 million acres and we expected prices to rise instead of fall.    However commodity funds were guessing less acres and it being the end of quarter, they liquidated some contracts and prices crashed after the release of the report.  Also, the strength of the US dollar was having some impact.  As a grain producer/marketer/manager, we lean one way or another based on our backyard.  When our eyes and experience tells us there are problems, we expect the markets to move higher.  It doesn’t always happen and we are usually skeptical of the market moves after the report.

There was a July World Agricultural Supply and Demand (WASDE) report on the 11th that they estimated corn ending supply in the US would be below 1.5 billion bushels.  That is kind of a magic number for these kinds of prices.  Fundamentally though most of the corn belt had received some beneficial rains (including many acres in East Central Illinois).  It was still dry but certainly not a disaster by any means.  The market reacted after this report and subsequent rains making it seem like the crop was nearing record yield territory.  So, it started down to the bottom of the last six months ($5.68).

In July, the large commodity funds were decreasing their positions in anticipation of a better crop.  Coupled with the strength of the dollar, it appeared that the market was headed lower or would trade sideways.   Weather was dry but not too hot and several of our acres In Eastern IL were getting small rains.  Commodity funds are a whole seperate discussion, but as a general rule they are necessary for liquidity in the markets.  In other terms a necessary evil.

By late August there were numerous “crop tours” estimating corn yields.  The most trusted/longest running national tour (Pro Farmer Crop Tour) spends a week sampling yields from Nebraska to Ohio.  They have a defined methodology and a large number of volunteer scouts/samples that they compile at the end of each day.  They have a Western tour that starts on Monday in South Dakota and Nebraska and ends in Eastern Iowa at the end of the week.  Their Eastern leg of the tour starts Monday morning in Ohio and ends in Eastern Iowa at the end of the week.  Most importantly they have the publicity and track record for the commodity markets to pay attention to the results.   The results confirmed a severe drought in the Western corn belt and disappointing results due to milder drought conditions in the East.  It was the first crack in the armor of the crop that the markets had contended was a good to above average crop for 2022.

Here is the September corn chart.

Dec’22 Corn Futures

Looking at the chart without the rest of the fall gives you a different perspective.  At this time, we were about 10 days away from full fledged corn harvest to confirm the yields that we had estimated.  It also shows the influence of the Pro Farmer crop tour.  There was another USDA report on October 12.

If you see my initial chart, you will notice that October 11 was the high in the market for the fall.  It was at this time that the market reacted to a good crop but not a huge crop.  As a reminder I am typically not a storer of your grain.  As a result, I marketed all of the unsold bushels across the scale in the fall.  This fall that was the best move for sure.  We have seen the market trade more or less sideways since then.  Holding the unsold bushels would not have paid for the storage or interest charges to date.

As a reminder here are the sales that I made for 2022 corn.

20% on 11/24/2021 at $5.53 Dec 22 Futures

10% on 3/2/2022 at $6.30 Dec 22 Futures

10% on 3/21/2022 at $6.66 Dec 22 Futures

10% on 4/18/2022 at $7.46 Dec 22 Futures

15% on 8/2/2022 at $6.00 Dec 22 Futures

Final bushels were sold at harvest.  Not one time did I sell at the high and my first sale was at a low level.  Each time I sold was because we saw reason to protect a good value.  It is what makes grain marketing so hard.  The final yields and the average price still ended up with very high to near historic revenue for the farms.  The chart below has the sale dates marked.


Sorry for the length of this post.  The next blog post will detail what happened in soybeans.  The third post will discuss 2023 crops and my thought process for sales and marketing moving forward.

As always, your feedback is welcomed and cherished.  Thank you for reading and enjoy your day!