From the last post you know that 2022 had some unexpected events that caused uncertainty in the grain markets. While the two primary commodities act in tandem most of the time, it is not always the case. The US is the big producer in Corn; the US and South America dominate the Soybean complex. This is a change that has happened during my 35 year career and has caused us to pay keen attention to what goes on in Brazil and Argentina (the two primary producers of soybeans in South America). Let’s dig deeper.

(Barchart.com, n.d.)
2022 Soybean Chart 1/1/2022-12/31/2022
Again apologies for using the March soybean chart but it was all that was available for this presentation. The spread on soybeans the last two years has been inverted ( the future month is lower than the lead new crop month, November). Currently the spread between November 23 soybeans and March 24 soybeans is -.11. In market terms, they want the soybeans at harvest more than they want them in January or February 2024. For this discussion, we will assume that the prices in the chart above are similar to the November 2022 chart (though we know that at times during the year the spread was a little higher or a little lower than the November price).
So the low for the year was right at the beginning of the year 1/3/2022 at $12.56 (the first red tick mark). The next tick mark is at the high of the year $15.72 on June 9th. The market fell quickly to $12.99 on July 22nd and rose back to $15.08 on September 13th. Coincidentally harvest begins in September so the market reacted and fell to $13.71 on October 6th, analyzed harvest data and rose to $15.24 on December 30, 2022. If you look at the numbers without the charts it doesn’t appear to be too volatile. The charts help tell that story more completely. The last tick mark shows that the market rose to $15.48 ½ on January 18th, but closed that day down 15 cents at $15.24.
Those moves up $3.16 to down $2.73, up $2.09, down $1.37 and finally up $1.53 demonstrate that extreme volatility. This was the main driver for my market strategy on soybeans last year. It is really hard to mentally weather those kinds of swings. Sometimes we are busy and don’t catch the movement, but most times we are trying to figure why we were so wrong. In the grain markets it seems the glass is always half empty and never half full. Grain marketing is difficult and not always rewarding.
Supply and Demand
It is hard to have any sort of discussion about soybeans with out talking about the major world players. The two largest producers are the US and South America. Their growing seasons are exactly opposite meaning when we are planting, they have just finished harvest. When we are harvesting, they are starting to plant. For the consumers or end users, this gives ample opportunity to secure supply. It is rare that both major producers have production hiccups in the same year. So while the end users preferred producer (US or South America) may be short of supply, the next largest producer’s supply is only six months away from export.
The primary consumer by a factor of almost seven is China. China is estimated to import 96 million metric tons of soybeans from the 2022 US crop and 2023 South American crop. The next closest importer is the European Union at 14.4 million metric tons. China is the elephant in the room for sure. This may be some insight into why Chinese relations are important to Agriculture. What is a metric ton? 1,000 kilos or 2,205 pounds make a metric ton. The conversion to bushels is China will buy 3.5 billion bushels of soybeans in 2022-23. The estimated US exports in 2022-2023 is about 2 billion bushels, so we are the #1 exporter in the world with South America close behind. We will use 2.3 billion bushels domestically in 2022-23.
In the January 2023 WASDE report, the US was expected to have only 4.8% of the crop left over at the end of September 2023. That sounds like it is plenty since the 2023 harvest will be coming on, but it does leave a fair amount of fear for the growing season. More discussion about 2023 crops on the next post.
Actual Results
Here is the chart showing sales made for the 2022 soybean crop.
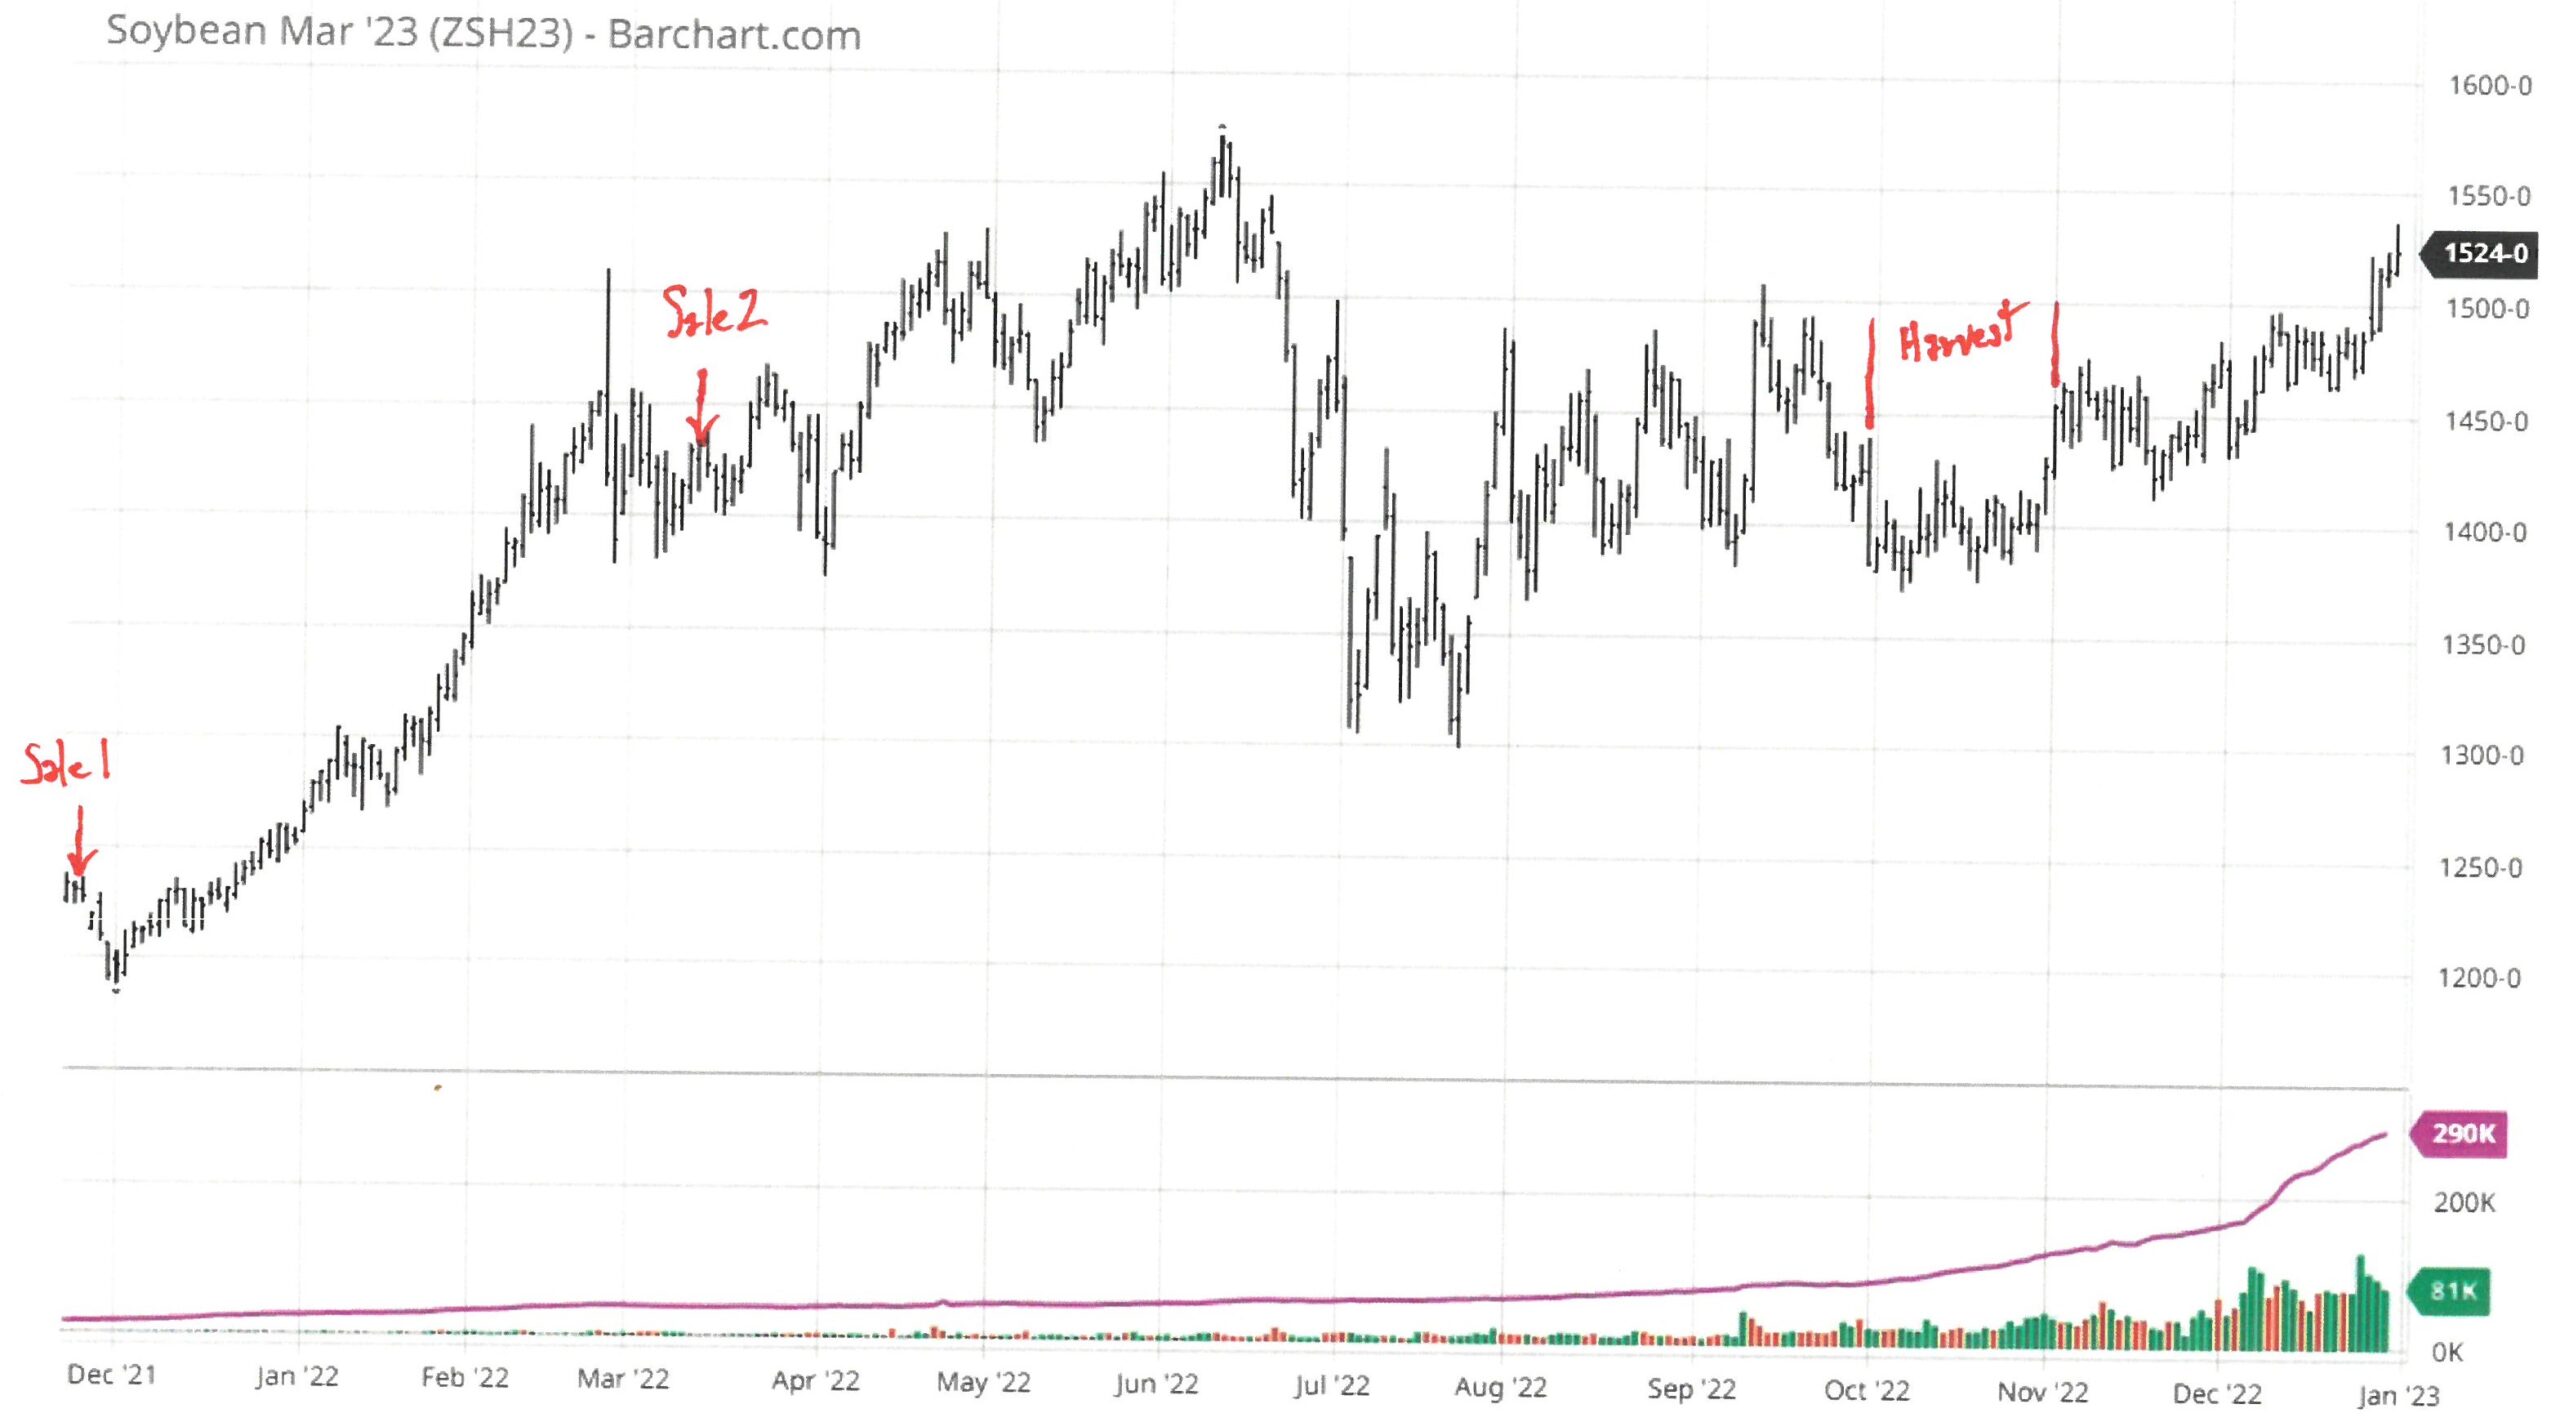
(Barchart.com, n.d.)
The first sale on 11/23/2021 was a min/max contract for 40% of the expected production at a price no lower than $12.40 and no higher than $12.90. The final price was $12.8358 (nearly at the maximum of the range). The second sale on 3/14/2022 for 20% of the expected production was a min/max contract at a price no lower than $14.40 and no higher than $15.20. The final price was $14.7486 (about the mid- point of the range). The final sale was made at harvest.
The reason for the min/max approach was we really were not sure of the direction of the market. It sets the minimum price and gives you some upside for the future. The other choices were to price the first portion at $12.30 less a 12 cent fee (which wasn’t attractive at that point) and $14.23 less a 10 cent fee which again wasn’t attractive. Looking back the biggest mistake was biting off such a big chunk of the crop at the beginning. The issue was that we were coming off a mediocre crop with very little exports.
Specifically the USDA in November 2021 was projecting a $9.00 average price for sale of 2022 soybeans. A $12.40 sale looked too good. Then ironically in January 2022, the USDA adjusted the WASDE balance sheet and lowered the beginning balance to start the season (Unfortunately, this is not uncommon for the reporting we get from the USDA!). As you can see the market began it’1s ascent to higher levels fueled by that and the Ukrainian conflict. The second sale was again out of concern that we might have a key market reversal. Again, did not turn out to be the case, but that sale was certainly respectable.
Conclusion
I have prepared these posts not as an excuse for lower prices than I hoped for this crop, but to give you, the reader, insight to the cycle that we see in agriculture. This cycle is annual in nature and comes with many twists and turns. Like the weather, the grain market is uncontrollable. It has the ability to reward and challenge even the most seasoned marketers. This presentation is as much for me to reflect and critique my methods and results as it is to inform you. It is always our goal to do better, admit our mistakes, exceed expectations and work harder for all of our clients.
Next week I will discuss the 2023 outlook and sales completed to date. Thank you for your time!