Unfortunately this is a question that has no defined answer and one we look to answer every year at this time. There are several factors that help show us direction and definition but as always, the best marketing plans can be the wrong plans in the midst of two dry weeks in June or July.
I hope to start the discussion by looking at the immediate past. Here is the chart for 2022 corn (It is a March chart as December 22 is no longer available. Prices are about 6 to 15 cents higher than December but it is all relevant to the story).
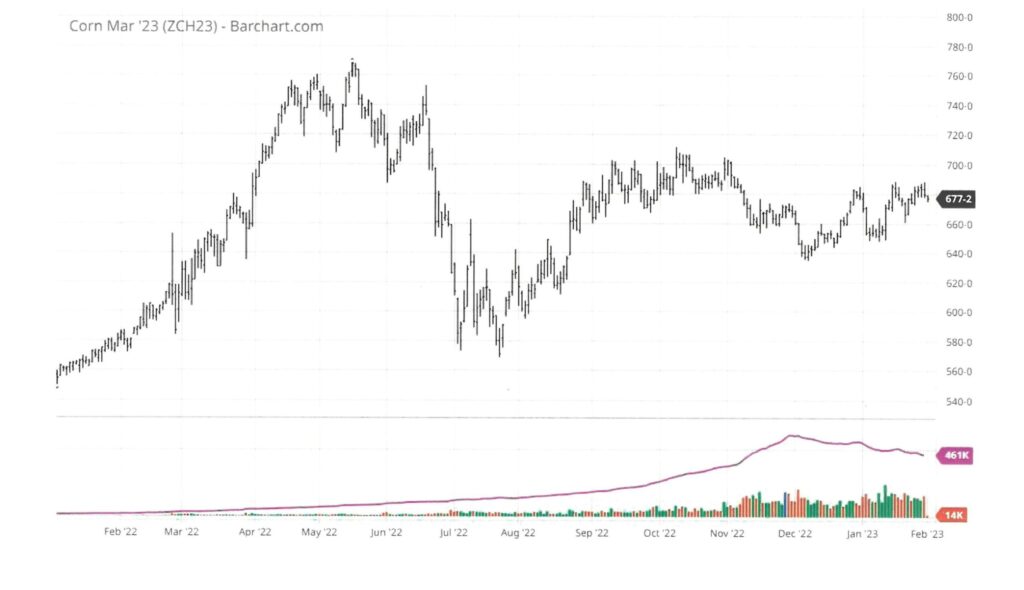
As I discussed in my client letters this year, the low was in the first trading day of the year. The high was in mid-May, the next low was in mid-July. The difference in that market move was EXACTLY $2.00 per bushel. The next leg up was $1.43 per bushel and that high was October 10. Why look backwards when the results are in and finished? This is one of the most dramatic markets in my 35-year career. It left many opportunities for wins and just as many opportunities for losses. We are faced with opportunities every single year. Most don’t have this kind of drama involved.
So, what were the market signals that drove the market to the extremes. The first mover was the war in Ukraine. Uncertainly leads to volatility. Volatility means opportunity. We don’t always recognize those but we are aware that something is happening. The conflict was much about uncertainty and the most fertile region in eastern Europe. Ukraine is a large producer of wheat, sunflowers and corn. They export to much of the Eastern hemisphere. The ports being closed was/is a big deal but there was messaging that it would not last or might be short-lived. Ports closed and exports stopped. First factor of the market (and unexpected in November of 2021).
The second factor was the USDA planting intentions report on March 31, 2022. Corn acreage came in below expectation and the effect to the supply demand balance sheet for corn was thought to be problematic. This reports tries to catch what farmers intend to plant during the growing season. Weather began to play a part in the markets in April as the war waged on. The price rose to $7.68 in mid-May. As happens most times, the corn crop got planted although it was already dry in the South (TX & OK) and the Dakotas. (Most times those areas are sort of non-factors).
When June 30th rolled around another USDA report for actual planted acreage was released. Corn dropped 28 cents after the release of the numbers. Sadly, the acreage was down 1.18 million acres and we expected prices to rise instead of fall. However commodity funds were guessing less acres and it being the end of quarter, they liquidated some contracts and prices crashed after the release of the report. Also, the strength of the US dollar was having some impact. As a grain producer/marketer/manager, we lean one way or another based on our backyard. When our eyes and experience tells us there are problems, we expect the markets to move higher. It doesn’t always happen and we are usually skeptical of the market moves after the report.
There was a July World Agricultural Supply and Demand (WASDE) report on the 11th that they estimated corn ending supply in the US would be below 1.5 billion bushels. That is kind of a magic number for these kinds of prices. Fundamentally though most of the corn belt had received some beneficial rains (including many acres in East Central Illinois). It was still dry but certainly not a disaster by any means. The market reacted after this report and subsequent rains making it seem like the crop was nearing record yield territory. So, it started down to the bottom of the last six months ($5.68).
In July, the large commodity funds were decreasing their positions in anticipation of a better crop. Coupled with the strength of the dollar, it appeared that the market was headed lower or would trade sideways. Weather was dry but not too hot and several of our acres In Eastern IL were getting small rains. Commodity funds are a whole seperate discussion, but as a general rule they are necessary for liquidity in the markets. In other terms a necessary evil.
By late August there were numerous “crop tours” estimating corn yields. The most trusted/longest running national tour (Pro Farmer Crop Tour) spends a week sampling yields from Nebraska to Ohio. They have a defined methodology and a large number of volunteer scouts/samples that they compile at the end of each day. They have a Western tour that starts on Monday in South Dakota and Nebraska and ends in Eastern Iowa at the end of the week. Their Eastern leg of the tour starts Monday morning in Ohio and ends in Eastern Iowa at the end of the week. Most importantly they have the publicity and track record for the commodity markets to pay attention to the results. The results confirmed a severe drought in the Western corn belt and disappointing results due to milder drought conditions in the East. It was the first crack in the armor of the crop that the markets had contended was a good to above average crop for 2022.
Here is the September corn chart.
Dec’22 Corn Futures
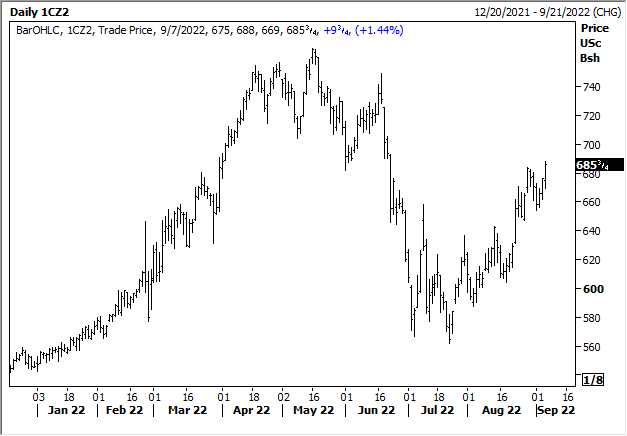
Looking at the chart without the rest of the fall gives you a different perspective. At this time, we were about 10 days away from full fledged corn harvest to confirm the yields that we had estimated. It also shows the influence of the Pro Farmer crop tour. There was another USDA report on October 12.
If you see my initial chart, you will notice that October 11 was the high in the market for the fall. It was at this time that the market reacted to a good crop but not a huge crop. As a reminder I am typically not a storer of your grain. As a result, I marketed all of the unsold bushels across the scale in the fall. This fall that was the best move for sure. We have seen the market trade more or less sideways since then. Holding the unsold bushels would not have paid for the storage or interest charges to date.
As a reminder here are the sales that I made for 2022 corn.
20% on 11/24/2021 at $5.53 Dec 22 Futures
10% on 3/2/2022 at $6.30 Dec 22 Futures
10% on 3/21/2022 at $6.66 Dec 22 Futures
10% on 4/18/2022 at $7.46 Dec 22 Futures
15% on 8/2/2022 at $6.00 Dec 22 Futures
Final bushels were sold at harvest. Not one time did I sell at the high and my first sale was at a low level. Each time I sold was because we saw reason to protect a good value. It is what makes grain marketing so hard. The final yields and the average price still ended up with very high to near historic revenue for the farms. The chart below has the sale dates marked.

Sorry for the length of this post. The next blog post will detail what happened in soybeans. The third post will discuss 2023 crops and my thought process for sales and marketing moving forward.
As always, your feedback is welcomed and cherished. Thank you for reading and enjoy your day!